Fig. 2.6 / Case study
Customer segmentation
Behavioural segmentation with finite mixture models for a cashback website: over 40% of customers would have landed in a different segment under k-means.
Customer segmentation provides many commercial advantages. Segmentation allows you to inform and market to people in a tailored and targeted manner with the right message, right tone, at the best time and through the best medium of communication to provide increased engagement, loyalty and value. You can also make more personalised offerings, for example, tailoring the web site to the customer segment. You are able to provide more insight into company achievement by breaking performance down by segment and thus identifying where the market and your company are headed. You can also use segmentation for market testing and sampling. A representative sample of customers needs to be representative across all customer segments, or alternatively, appropriately scaled where the sample is biased.
There are many ways to segment a customer base: geographic, demographic, lifestyle, RFV, etc. but it is only when companies invest in a truly behavioural segmentation that you reap the real benefits. This may seem obvious – it is how the customers actually interact with the company and its products/services that the company wants to measure and influence. However, it is only in the digital era that the sort of interaction data required (purchase history, product/service use, website views and searches, social network activity, etc.) is routinely available to allow companies to become truly customer-centric. Unfortunately, many companies continue to operate as if they are still in a pre-digital non-customer-centric culture.
Not only are there many types of customer segmentations but there are several different segmentation techniques to choose to implement: for example, K-means, Chaid, Density-based clustering (e.g., Dbscan). However, in most situations our method of choice for customer segmentation is the statistically-based finite mixture model. This method has many advantages: (i) it is objectively data-driven rather than arbitrarily making a cut at say 3 years of tenure or £50 of spend, (ii) it combines multiple attributes together and can account for correlations between them (as opposed to Chaid, which treats each attribute in turn), (iii) unlike K-means and Dbscan, there is no need to a priori define an overall distance measure or weighting for each attribute because the algorithm discovers the optimal weighting of how important each attribute is; and what’s more it discovers optimal weightings for each segment rather than just one overall weighting, (iv) category variables – i.e., attributes that cannot be ordered, such as mobile device type used, can fit naturally into the framework, and (v) the probabilistic approach provides an estimate for how strongly each customer is associated with each segment – thus, for example, if you wanted to run a marketing campaign to 50,000 customers that’s targeted towards Segment X, which only has 35,000 customers, then you can identify the next 15,000 customers most closely associated with Segment X. Alternatively, you could market to the 10,000 customers who are really most core to Segment X out of the 35,000 customers therein.
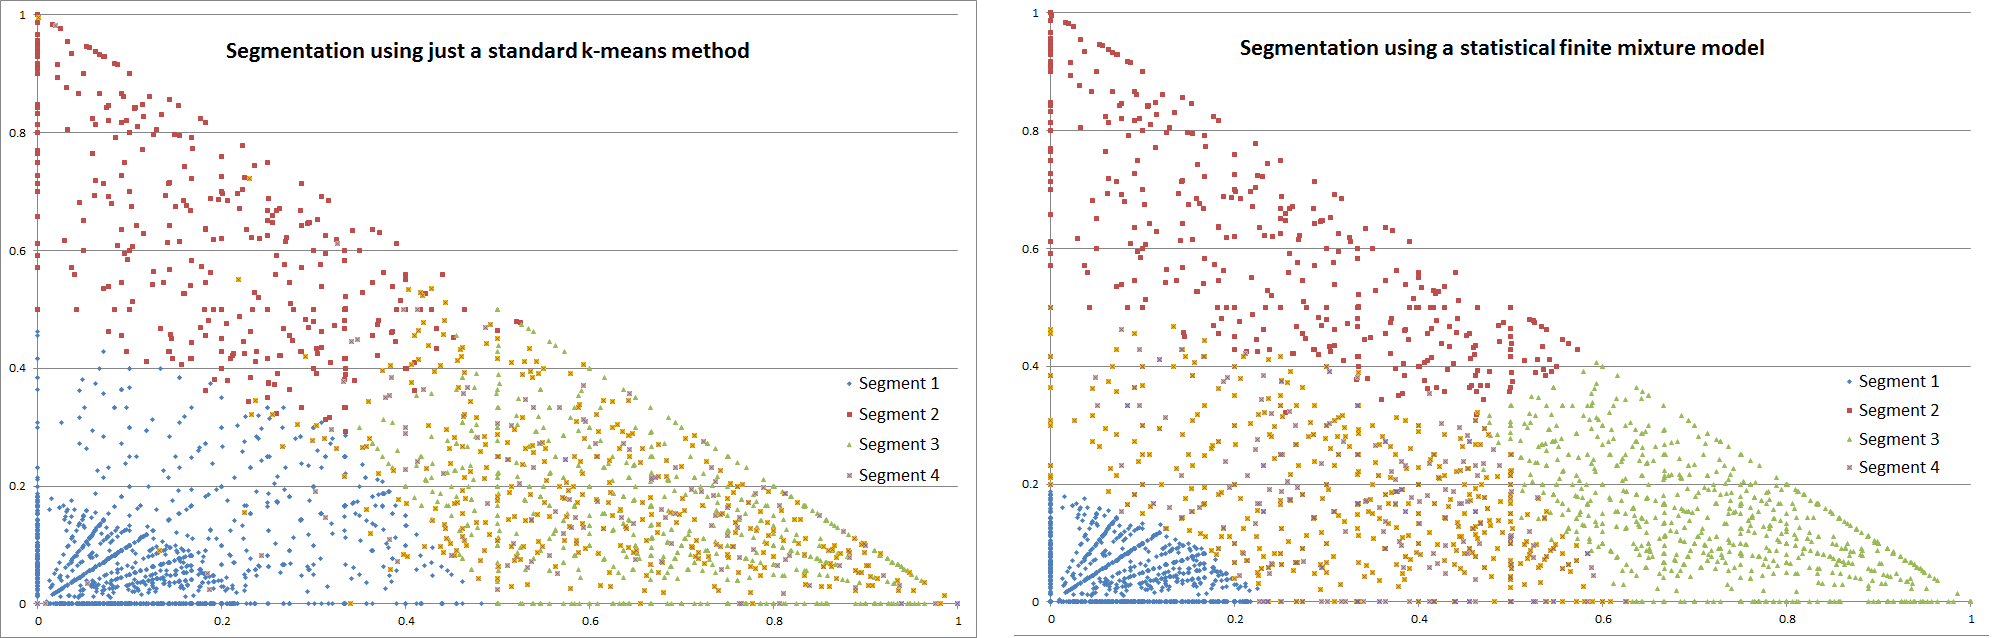
More recently, we ran a customer segmentation project for a cashback website. Again, we chose the finite mixture model approach for the reasons outlined above. For obvious commercial reasons, we cannot show the segmentation we actually produced, but the two plots below uses the actual customer data and the segmentation we would have got had we just used four attributes of the data. The attributes used for each customer are (i) the number of transactions by that customer (not shown) and (ii) the fraction of those transactions into each of the three groups of merchants that we formed. The plots are a projection from those four attribute dimensions onto the plane represented by the fraction of transactions in each of two merchant groups – hence the triangular shape since the sum of the fractions to all three merchant groups must sum to 1. Note that some of the segmentation takes place in the other two dimensions not drawn here, which produces the apparent slight overlap in the segments. In each plot, each point represents a customer and is coloured by the segment that customer belongs. Note this is a projection down on to just two attributes – other attribute dimensions are not shown and hence the apparent overlap of customers in some segments (if it were possible to show the other two dimensions this overlap would disappear).
What is also striking is that the k-means method has no local definition of distance and thus all segments take approximately equal physical size in attribute space. The finite mixture model, however, is able to produce a smaller physical segment for the blue segment given the high density of users in that part of attribute space. It is also able to suppress the relative importance of the other two attribute dimensions not shown specifically for the red and green segments, giving these segments better definition in the attribute dimensions that are most important for them.
Even in this simple model with just 4 dimensions and 4 segments, over 40% of the customers would end up in a different segment under the standard k-means method compared with the more sophisticated finite mixture model. With higher dimensions and more segments the problem gets even worse, and even more so if the input data has not been filtered and transformed optimally. This means that with a weaker segmentation, over 40% (and much more) would likely be receiving the wrong marketing message, or at least one that isn’t optimised for them. The effects of which can be to make the customer more disengaged rather than more engaged.
This is allowing the cashback website (i) to produce more effective customer relationship management (CRM) so campaigns are much more relevant, (ii) to drive better customer insight and understanding, and (iii) to help provide personalised marketing and web page personalisation.
By using a better segmentation, you create much greater customer engagement, loyalty and value through more targeted marketing, personalised offerings, more relevant reporting, more accurate testing and better predictions/forecasts/understanding of customers.